File:Cross-plot 1.png
Cross-plot_1.png (409 × 277 pixels, file size: 3 KB, MIME type: image/png)
Summary
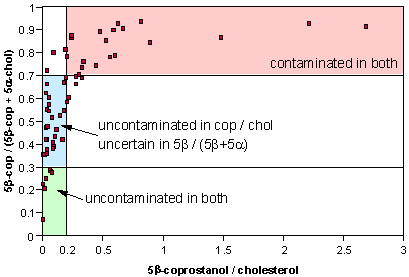
A plot of data collected and analysed by Smmudge 09:36, 2 November 2006 (UTC) (the contributor of the image). Two different measures of faecal contamination are shown as a cross plot and indicate where and when they agree and where they don't. Using two separate measures increases the confidence in identifying contaminated sites. Figure drawn by Stephen M Mudge, 2006. Smmudge 09:36, 2 November 2006 (UTC).
Licensing
| I, the copyright holder of this work, hereby release it into the public domain. This applies worldwide. If this is not legally possible: |
 | This file is a candidate to be copied to Wikimedia Commons.
Any user may perform this transfer; refer to Wikipedia:Moving files to Commons for details. If this file has problems with attribution, copyright, or is otherwise ineligible for Commons, then remove this tag and DO NOT transfer it; repeat violators may be blocked from editing. Other Instructions
| ||
| |||
File history
Click on a date/time to view the file as it appeared at that time.
| Date/Time | Thumbnail | Dimensions | User | Comment | |
|---|---|---|---|---|---|
| current | 09:36, 2 November 2006 | | 409 × 277 (3 KB) | Smmudge | A plot of data collected and analysed by ~~~~ (the contributor of the image). Two different measures of faecal contamination are shown as a cross plot and indicate where and when they agree and where they don't. Using two separate measures increases the c |
File usage
The following page uses this file: