Interquartile range
Interquartile range (IQR) is a measure of statistical dispersion, being equal to the difference between the upper and lower quartiles, Q3 and Q1. The IQR is the first quartile subtracted from the third quartile; these quartiles can be clearly seen on a box plot on the data.
Definition[edit]
The interquartile range is a measure of where the “middle fifty” is in a data set. Where a range is a measure of where the values lie, the interquartile range is a measure of where the central values lie. The IQR is used in statistics to identify outliers.
Calculation[edit]
To calculate the interquartile range:
- Order the data from least to greatest
- Find the median
- Construct a list of the lower half of the data (not including the median if the data set is odd)
- Find the median of this lower half. This is the first quartile, Q1.
- Construct a list of the upper half of the data (not including the median if the data set is odd)
- Find the median of this upper half. This is the third quartile, Q3.
- Subtract Q1 from Q3 to find the interquartile range.
Applications[edit]
The interquartile range is often used in conjunction with other statistical tools, such as the box plot, to provide a graphical representation of statistical dispersion in a set of data. It is also used in statistical analysis to identify and manage outliers, as it is less sensitive to extreme values than other measures of dispersion.
See also[edit]

This WikiMD article can only be edited by registered and verified editors. You can log in or register.
-
Boxplot vs Probability Density Function
-
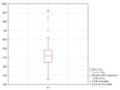 Box-Plot mit Interquartilsabstand


Medical Disclaimer: WikiMD is for informational purposes only and is not a substitute for professional medical advice. Content may be inaccurate or outdated and should not be used for diagnosis or treatment. Always consult your healthcare provider for medical decisions. Verify information with trusted sources such as CDC.gov and NIH.gov. By using this site, you agree that WikiMD is not liable for any outcomes related to its content. See full disclaimer.
Credits:Most images are courtesy of Wikimedia commons, and templates, categories Wikipedia, licensed under CC BY SA or similar.
Translate page: - East Asian
中文,
日本,
한국어,
South Asian
हिन्दी,
தமிழ்,
తెలుగు,
Urdu,
ಕನ್ನಡ,
Southeast Asian
Indonesian,
Vietnamese,
Thai,
မြန်မာဘာသာ,
বাংলা
European
español,
Deutsch,
français,
Greek,
português do Brasil,
polski,
română,
русский,
Nederlands,
norsk,
svenska,
suomi,
Italian
Middle Eastern & African
عربى,
Turkish,
Persian,
Hebrew,
Afrikaans,
isiZulu,
Kiswahili,
Other
Bulgarian,
Hungarian,
Czech,
Swedish,
മലയാളം,
मराठी,
ਪੰਜਾਬੀ,
ગુજરાતી,
Portuguese,
Ukrainian
