Pearson correlation coefficient
Pearson correlation coefficient, also known as Pearson's r, is a measure of the strength and direction of association that exists between two continuous variables. It is a method of correlation: a statistical technique used to determine the degree to which two variables are related. The coefficient values range from -1 to 1, where -1 indicates a perfect negative linear relationship, 0 indicates no linear relationship, and 1 indicates a perfect positive linear relationship.
Definition[edit]
The Pearson correlation coefficient is defined as the covariance of the two variables divided by the product of their standard deviations. Mathematically, it is represented as:
\[ r = \frac{n(\sum xy) - (\sum x)(\sum y)}{\sqrt{[n\sum x^2 - (\sum x)^2][n\sum y^2 - (\sum y)^2]}} \]
where:
- \(n\) is the number of data points,
- \(x\) and \(y\) are the variables,
- \(\sum\) denotes the summation.
Interpretation[edit]
The value of the Pearson correlation coefficient indicates the strength and direction of the linear relationship between two variables. A value close to 1 implies a strong positive relationship, a value close to -1 implies a strong negative relationship, and a value around 0 implies no linear relationship.
Assumptions[edit]
The calculation and interpretation of Pearson's r assume that:
- Both variables are normally distributed.
- The relationship between the variables is linear.
- The data is homoscedastic, meaning the variance within each variable is the same.
Applications[edit]
Pearson's r is widely used in the fields of statistics, psychology, medicine, and social sciences to measure the linear relationship between variables. It is particularly useful in research studies that aim to determine the strength and direction of relationships among continuous variables.
Limitations[edit]
While Pearson's r is a powerful tool for measuring linear relationships, it has limitations:
- It can only measure linear relationships and may not accurately represent non-linear relationships.
- It is sensitive to outliers, which can significantly affect the coefficient value.
- It assumes that the relationship between variables is linear and may not accurately reflect the complexity of real-world data.
See also[edit]
References[edit]
 | This statistics-related article is a stub. You can help WikiMD by expanding the page. |
-
Pearson correlation coefficient
-
Examples of correlation
-
Regression lines
-
 Pearson correlation and prediction intervals
 -
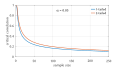 Critical correlation vs. sample size


Sponsored Health Resource

W8MD Weight Loss, Sleep & MedSpa
Looking for physician-supervised weight loss, semaglutide, tirzepatide, or GLP-1 receptor agonist options? W8MD helps eligible patients in New York City, Brooklyn, New Jersey, Connecticut, Pennsylvania, Delaware, and greater Philadelphia with medical weight loss, sleep medicine, and long-term maintenance support.
GLP-1 specials: Affordable GLP-1 injections NYC and Philadelphia starting from $29.99/week and up for semaglutide with insurance accepted for qualifying visits, and $45/week and up for tirzepatide with insurance accepted for qualifying visits. Self-pay options start from $59.99/week and up for semaglutide and $69.99/week and up for tirzepatide.
- Medical weight loss NYC
- Affordable GLP-1 injections NYC
- Budget GLP-1 weight loss shots Philadelphia
- New Jersey medical weight loss
- NYC medical weight loss blog
- Philadelphia weight loss blog
- Sleep medicine and sleep apnea services
- W8MD MedSpa and wellness
Book a W8MD appointment · View GLP-1 specials
Paid promotional message. Eligibility, pricing, insurance coverage, medication availability, and results vary. Medical evaluation required.

Medical Disclaimer: WikiMD is for informational purposes only and is not a substitute for professional medical advice. Content may be inaccurate or outdated and should not be used for diagnosis or treatment. Always consult your healthcare provider for medical decisions. Verify information with trusted sources such as CDC.gov and NIH.gov. By using this site, you agree that WikiMD is not liable for any outcomes related to its content. See full disclaimer.
Credits:Most images are courtesy of Wikimedia commons, and templates, categories Wikipedia, licensed under CC BY SA or similar.
Translate page: - East Asian
中文,
日本,
한국어,
South Asian
हिन्दी,
தமிழ்,
తెలుగు,
Urdu,
ಕನ್ನಡ,
Southeast Asian
Indonesian,
Vietnamese,
Thai,
မြန်မာဘာသာ,
বাংলা
European
español,
Deutsch,
français,
Greek,
português do Brasil,
polski,
română,
русский,
Nederlands,
norsk,
svenska,
suomi,
Italian
Middle Eastern & African
عربى,
Turkish,
Persian,
Hebrew,
Afrikaans,
isiZulu,
Kiswahili,
Other
Bulgarian,
Hungarian,
Czech,
Swedish,
മലയാളം,
मराठी,
ਪੰਜਾਬੀ,
ગુજરાતી,
Portuguese,
Ukrainian


